Developers Conference 2013
The Developers Conference took place in Brno this past weekend (February 23rd, 24th). The #devconf is an annual event organised by the Red Hat office in Brno with the members of the Fedora and JBoss.org communities. The convention targets primarily Linux and JBoss developers and admins and it covers a range of topics from the free software universe.
This year, there were three main tracks, one of which was focused primarily on JBoss and the remaining two on Linux-related topics, such as kernel, networking, security or virtualization/cloud technologies. Apart from that, the conference hosted a number of hackfests and lab sessions for people who wanted to learn something more practical, or have a more focused discussion on a certain topic.
Bryn M. Reeves talking at the Developers Conference
I was there this year and it was amazing. According to the numbers posted to Twitter, the conference had at least 500 attendees on Saturday. There were so many great talks and the organisers had to even turn down presenters, only because there was no room for more. Actually, I don’t think that three tracks will be enough next year.
Saturday
I didn’t get up very early, so for me, Saturday started with a talk from Debarshi Ray about the Gnome Online Accounts. Debarshi talked about how the new Gnome 3.8 integrates with various online services, such as Google Docs/Mail, Facebook, Flickr, ownCloud and others. The integration is a very promising area in my opinion, because these services are used by millions of people. However, there are still some problems that need to be addressed and that are being worked on.
The track in the D3 room continued with Tom Callaway‘s talk on Fedora User Experience. Tom explained the design driven methodology; that we should think about the user experience, before we code. However, the community around Fedora has been focused on the contributors, which are quite often technical people who like to code first. He presented several mockups they have been working on. The first one is a sort-of a rich web interface for mailing lists called Hyperkitty. The goal of this project is to improve the collaboration in communities. At the moment, there are two groups of users, one preferring mailing lists, the second discussion boards. People from these two group tend to miss each other. Hyperkitty should also provide a karma functionality, to help decrease the pollution of big mailing lists from chronically non-constructive people wasting everyone’s time with pointless discussions.

Hyperkitty Design (source: http://blog.linuxgrrl.com/)
The third presentation I saw, again in the D3 room was Negotiation theory for Open Source Hackers by Leslie Hawthorn. This was one of the less technical talks, but it was very insightful. Arguing takes up a fair amount of the time and effort technical people put into their work, especially in open source, and it is not always time well spent. The slides from this presentation are available here.
After Leslie’s talk, we moved to the kernel track in D1 to see Lukáš Czerner speak about what is happening in the local Linux Kernel File Systems. Lukáš summarized the new features from XFS (being the most suitable option for enterprise workloads), ext4 (great for general-purpose), and btrfs (still not stable). Based on the comparison of the number of commits made during the last year, the most active development is going on in btrfs. Its codebase also grows steadily while XFS have lost some weight during the last few years as its developers try to remove unnecessary things. He also discussed the challenges file system developers will need to deal with in the future. The rules of the game don’t change that much with SSD’s, but PCI-based solid-state drives can be problematic, as the current block layer doesn’t scale that well to storage technologies that fast. Similar increase of speed has already happened in networking, so the future development might be inspired by some ideas from that area.
After the file systems update, it was time for my talk about the Linux Network Stack Test project. LNST is a network testing tool designed to simplify testing of real-life scenarios with more than one computer involved. It provides some building blocks for test development and it also serves as a test management tool that will handle proper execution of your test cases. The tests created using LNST are then entirely automated and also completely independent from the underlying network infrastructure, so they can be migrated to a different network without any changes whatsoever. This is important when you want to share them with others.
Slides: You can download the slides I used for the LNST presentation here.
I took a short break from the presentations after that and I returned to see Daniel Borkmann with his presentation about the zero-copy packet capturing and netsniff-ng. At this point, I started to get really tired, so I certainly didn’t catch everything here. And finally, the kernel track was closed by three lighting talks by Jiří Benc on PTP, Jiří Pírko who gave us an update about what happened in the team driver, and Zdeněk Kabeláč who closed the room with his talk about LVM2.
If you came early enough to get a keyring at the entrance to the venue, you were in possession of a ticket to the after party, which took place approximately half an hour later at Fléda. The party was, just as the conference itself, awesome. There was beer and food for free, a live band, and most importantly hundreds of like-minded people and colleagues from Red Hat to talk to about Linux :).
Sunday
Sunday was again crammed with amazing talks. This time, I made sure not to oversleep (even though getting up after the party wasn’t easy at all). The very first talk in the morning in D3 was Evolution of Linux Network Management from Pavel Šimerda. Pavlix talked about the NetworkManager project, the things they improved in the 0.9.8 release (which happened just a few days prior to the conference). He explained what they focus on at the moment. NetworkManager is going from desktops to servers and it should be used as the primary way of network configuration in Fedora and also in RHEL. This requires revising various things inside the NetworkManager and also implementing additional functionality, that is required in the enterprise area. Networking is absolutely crucial on servers, so they plan to test the code very carefully using multiple different methods (one of them might be a set of real-life test scenarios using LNST).
Thomas Wöerner continued the networking track in D3 with his presentation of firewalld, a dynamic firewall daemon that provides dynamic functionality over the static iptables. The daemon supports network zones, which represent the levels of trust for network connections. These might be public, home, work, etc. Firewalld also supports working with rules grouped into services, which are basically lists of ports that are required for some service to work. This way, you can handle all the rules in a group at the same time.
The last networking talk in D3 before the Core OS track was given by Thomas Graf. The presentation was focused on Open vSwitch, which is a software implementation of a switch similar to the Linux bridge. However, Open vSwitch is focused more towards the enterprise market. It is designed for virtualized server environments, so it comes with support of things, such as OpenFlow and VLAN tagging.

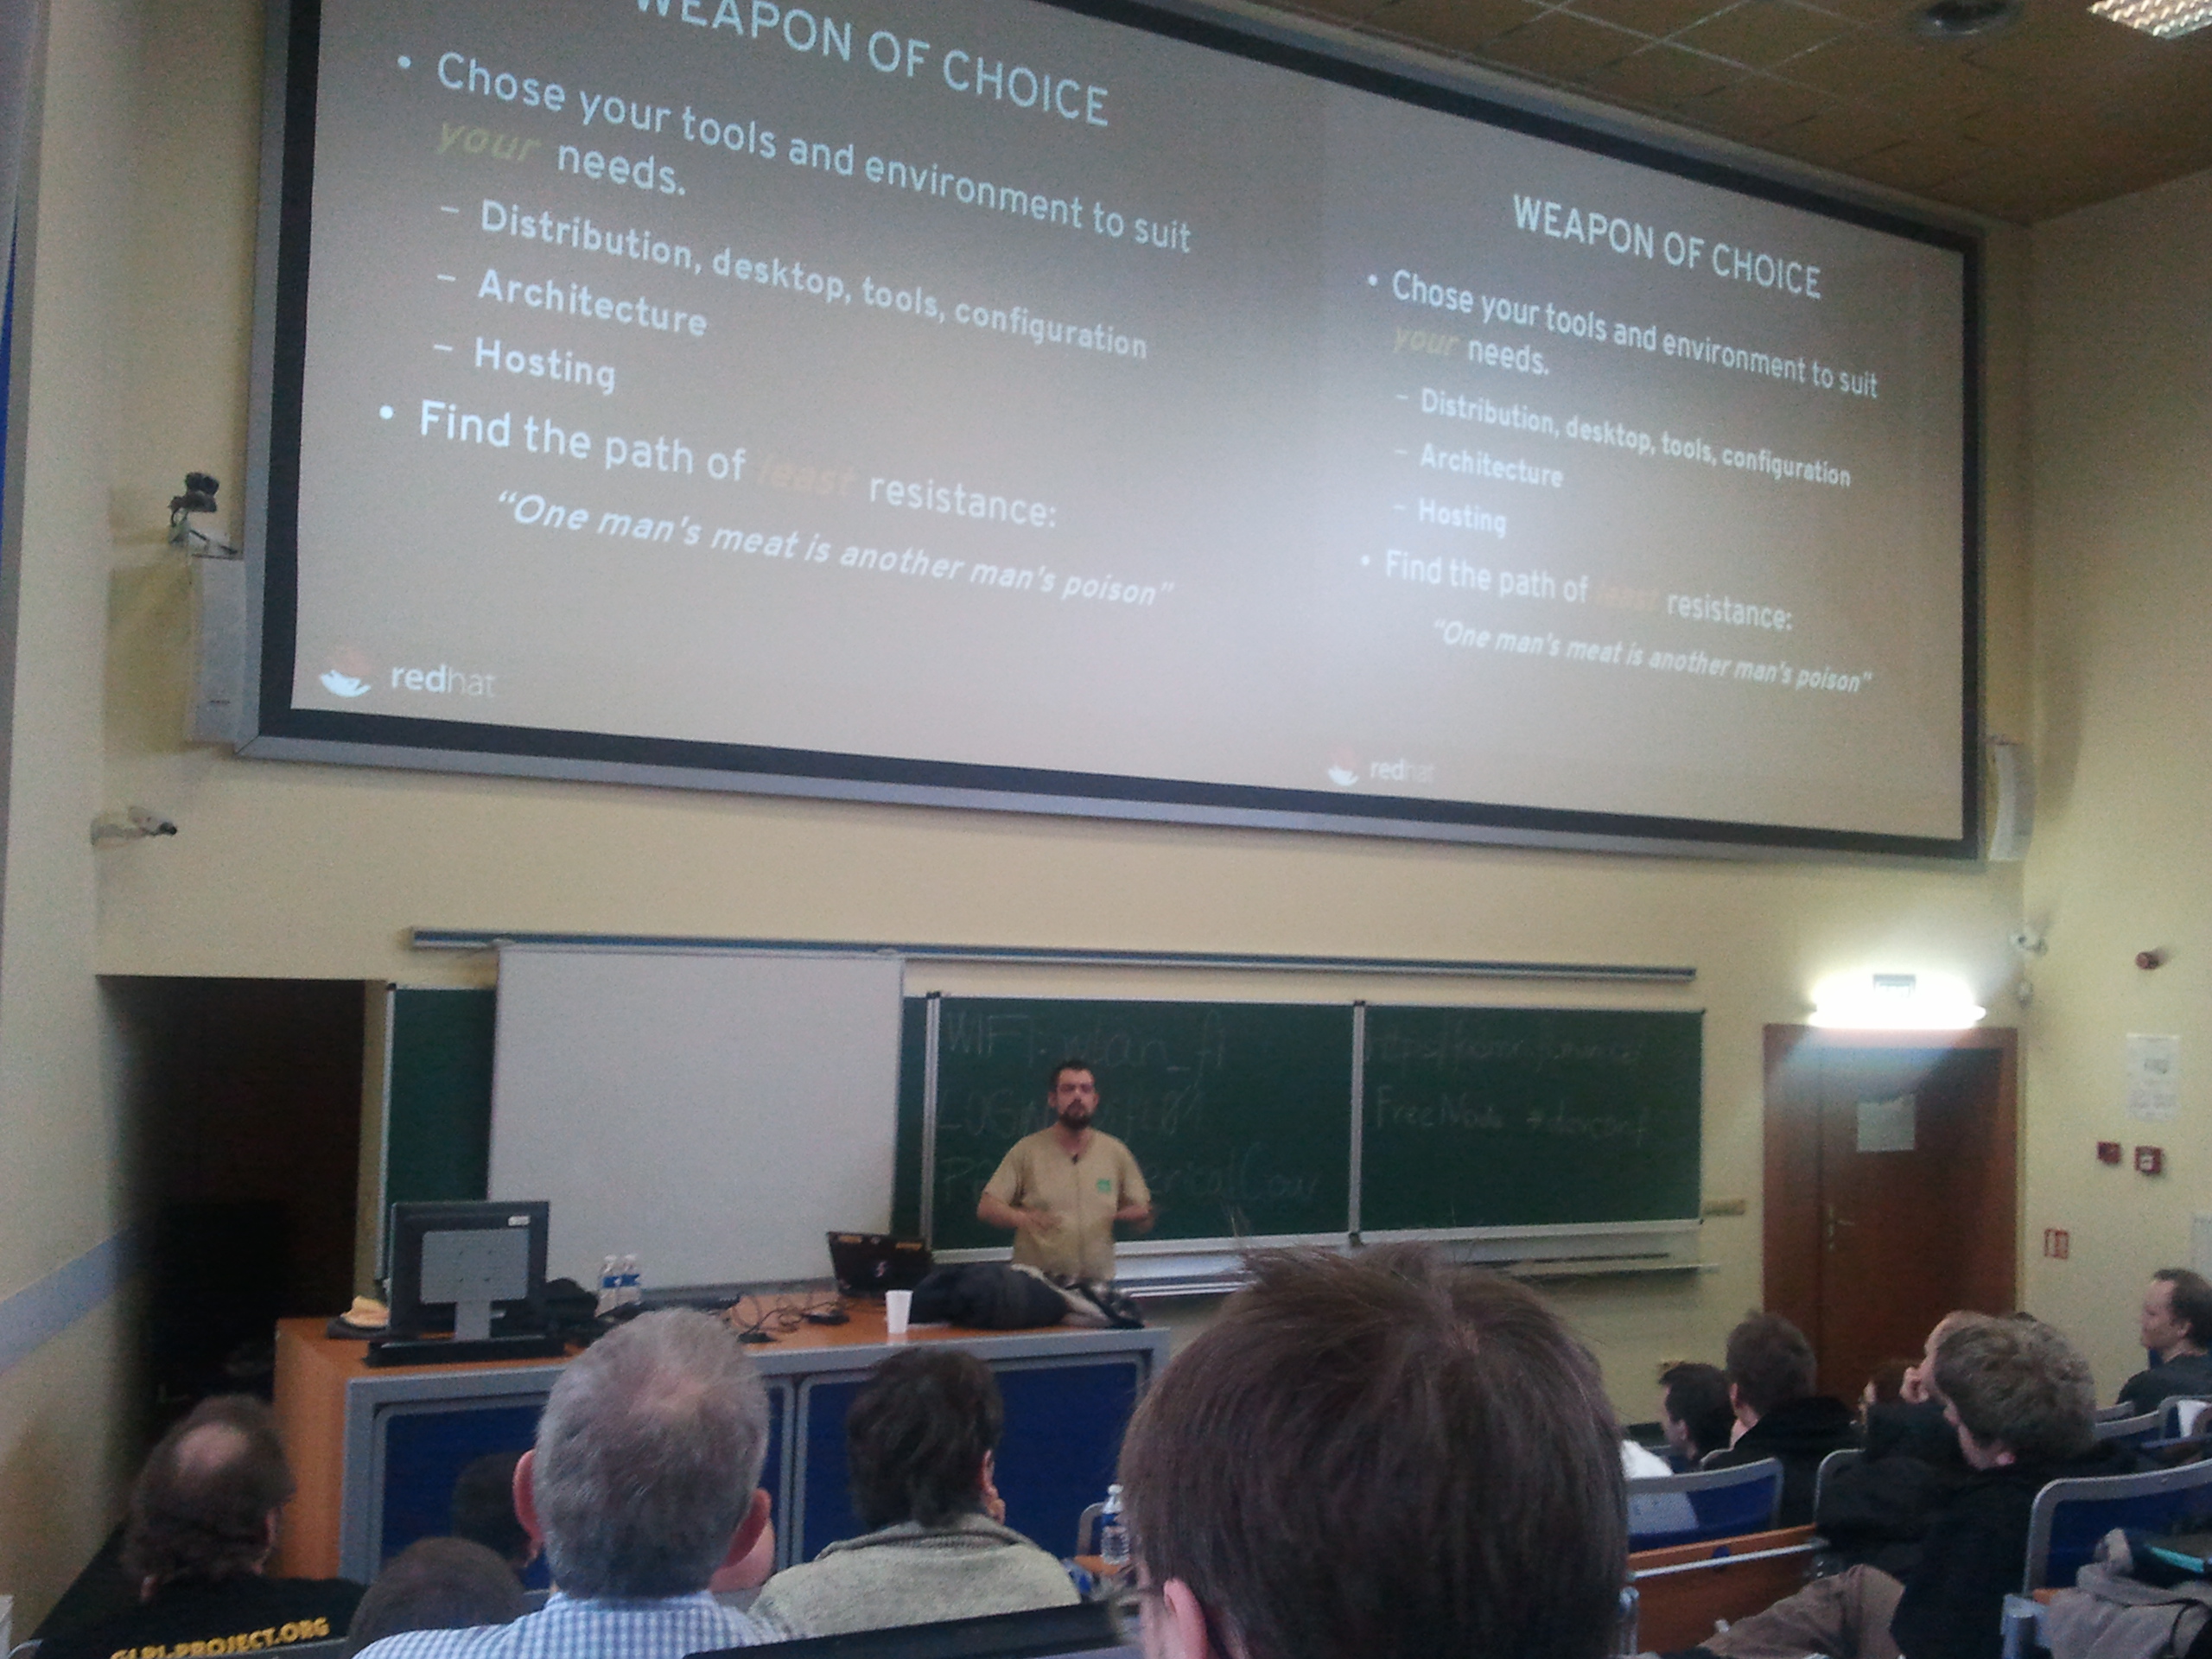
Preparations for What are we breaking now?
Probably the most crowded presentation at the Developers Conference was What are we breaking now? delivered by Kay Sievers and Lennart Poettering. They discussed several topics that (in their opinion) need fixing. The first one were persistent network interface names. This has been a problem for a long time, because the kernel names devices as it finds them and the order can change with every other boot. The plan is to use names based on some properties of the hardware, such as the position of the card on the bus, instead of just numbering them as they are recognised. Other than that, they would like to implement D-BUS in the kernel. There has been a couple of tries at this in the past, but they all failed. I personally liked the plan they mentioned next to modify the bootloader (GRUB2) and the kernelinstall script to work with drop-in config files when a new kernel is installed rather than with a convoluted set of self-replicating scripts. Finally, they mentioned app sandboxes that should provide some protection for the user from the actions of a potentially malicious third-party applications.
The Core OS track continued after a short break with a great talk from Bryn M. Reeves called Who moved my /usr?? – staying sane in a changing world. This talk was again a little bit lighter on the technical details, but as the last year’s presentation from Bryn, it was not only interesting, but very entertaining as well. The talk was focused on change. Bryn went through the historic releases of Red Hat Linux and described what happened where, and how did the users react.
I didn’t actually hear the whole talk that went after the previous one in D3, because my stomach was getting pretty unhappy at that time and I went down to get that extremely big hot dog. The leader of the SELinux project, Dan Walsh talked about and also demonstrated the creation of hundreds of secure application containers with virt-sandbox. The containers are much cheaper than virtualization, but they can provide the same amount of security.
Lennart Poettring had a one more talk in the Core OS track called Systemd Journal. This one was an introduction of the logging facility that will be a part of systemd. He explained the motivation, why they decided to go down this path and what are (in his opinion) the benefits of journald. In the second part of the presentation, Lennart did a small demonstration of what can be done with the journalctl tool for reading logs.
The very last talk I attended at this year’s Developers Confefence was the Log Message Processing, Formatting and Normalizing with Rsyslog from the main author of the rsyslog project Rainer Gerhards, but I was getting really tired and sleepy again, so unfortunately I wasn’t listening that carefully.
Summary
Long story short, this year’s #devconf was awesome! Lots of interesting talks, labs, and hackfests. If you missed a talk this year, the good news is, that all the presentations from the three main rooms were recorded. The videos should be soon available online.
Big thanks goes to the main organisers, Radek Vokál and Jiří Eischmann, for making this possible, but also to the many volunteers that were involved in the organising and making sure everything went as planned. For me, the organisation was flawless, as I personally didn’t encounter any difficulties. Man, I’m already looking forward to 2014. See you everyone next year!
If you liked this post, make sure you subscribe to receive notifications about new content on this site by email or a RSS feed.
Alternatively, feel free to follow me on Twitter or Google+.